This is an old revision of the document!
Screenshots
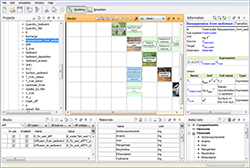
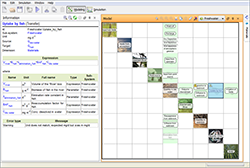
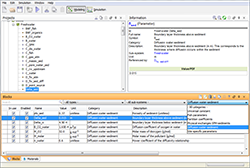
The user interface of Ecolego features many windows that provides information about the model.
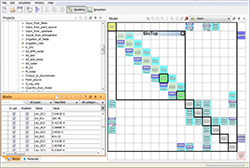
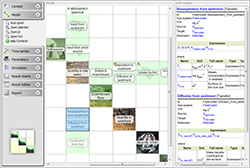
By using hierarchical containers, large models can be separated into smaller, more easily managed components.
The information screen displays information about the currently selected objects.
Generate reports that can be saved in many different formats.
The search functionality allows model components to be found easily.
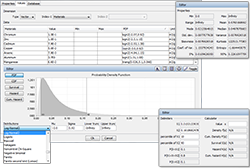
Ecolego has many different probability density functions that can be assigned to parameters. The PDF tool also allows the user to directly get statistics on the functions.
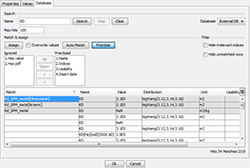
 By populating the local database, or by connecting to an external database, management of parameters is centralized. The database can be browsed when assigning values to parameters.
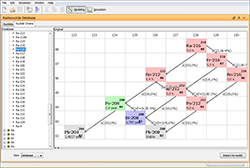
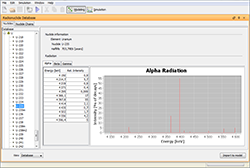
Ecolego features a built-in radionuclide database.
Decay chains can be automatically generated and imported into the project.
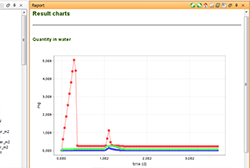
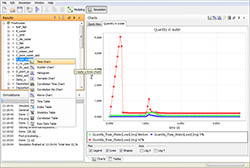
Many different charts are available for presentation of simulation results.
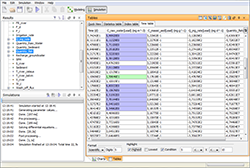
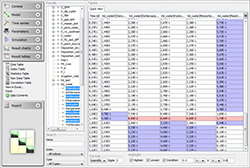
Tables can be used to present and investigate simulation data.
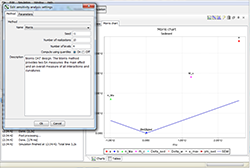
The sensitivity analysis toolbox addon provides extra sensitivity analysis methods.
The Ecolego Player can be downloaded and used by anyone to make assessments using models created in Ecolego. The Ecolego Player provides the same features as Ecolego for running simulations and analysing results.

