Relationships window
Select Window | Relationships to access this window.
The relationships window displays relationships between blocks in the model. Three types of relations are displayed:
- Reference - When a block is used in an equation for another block.
- Transfer - Connections between compartments and transfer blocks.
- Connector - When a block is used as an input for another block.
This window serves a similar purpose of the information window, but with a graphical interactive approach. It is useful to see how the different blocks are related and also, when used together with the result window, for debugging models.
To create a relationship graph, select the block of interest in some other view. The window now updates to show the selected block as well as all blocks it has direct relations with.
Trailing
When a graph has been created, relatives of the selected block may display a small plus (+) symbol in the upper left corner. Clicking this button will add all the relations with the clicked block. This way you can navigate and trail the relationships from a given block.
Direction
By default all relations of the selected block are displayed, but you can choose to show only incoming or outgoing relations by clicking the corresponding title bar buttons or by right-clicking and choosing the direction from the popup menu.
The images below show the relations for the Concentration Sediment expression.
| All relationships | Incoming relationships | Outgoing relationships |
 | 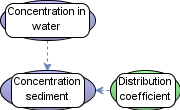 | 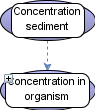 |
Title bar
The title bar has short-cuts for common tasks:
 | Adjust zoom to show the full graph |
 | Zoom in |
 | Zoom out |
 | Shows all relationships |
 | Shows only outgoing relationships |
 | Shows only incoming relationships |
Menu
To display the menu, right click anywhere inside the window.
| Toggle grid | Turn the graph grid on/off |
| Print… | Print the current graph. |
| Zoom | |
| Zoom in | Zoom in |
| Zoom out | Zoom out |
| Restore zoom | Adjust zoom to show the full graph |
| Direction | |
| Both | Show both incoming and outgoing relations |
| Outgoing | Show only outgoing relations |
| Incoming | Show only incoming relations |
| Tools | |
| Export… | |
| Layout | Perform a new layout of the graph |
See also
