Table of Contents
Correlation table
Overview
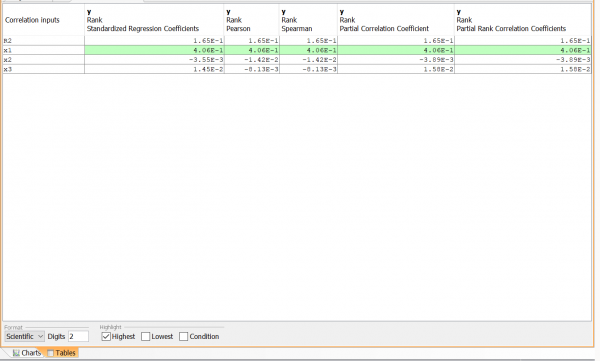
Tables allow simulation data to be presented in a tabular form. The correlation table is used after a sensitivity analysis to present correlation coefficients between model inputs and model outputs. The table is only available after a probabilistic simulation or a sensitivity analysis has been performed.
For a correlation table, the following dimensions are available:
- Outputs - The outputs that have been selected for the table.
- Time - If any of the outputs is time dependent, then the time dimension allow you to select which time points to show data for. It is also possible to show the minimum/maximum value across the time vector and the time points for which the minimum or maximum occurs.
- Indices - For each dimension of the selected outputs, a dimension is available for the table data. These dimensions allow you to select all, or only a sub-set of the indices of an index list.
- Correlation type - The coefficients to calculate.
- Inputs - Whether to include all inputs or only inputs that can influence the selected objects. This dimension can also include an R2 value.
- Transformation - How to transform the data before the coefficients are calculated (none, rank or log)
Creating a correlation table
From the results window (Recommended)
- Right-click the outputs that you want to include and select Correlation Table from the popup-menu.
From the tables window
- Right-click the tables window and select Create | Correlation Table from the popup-menu.
Table controls
The controls beneath the table let you change the appearance of the table.
- Format - Select either scientific or decimal format
- Digits - Select the number of digits to show
Highlight
- Highest - Select to highlight the highest value in each column.
- Lowest - Select to highlight the lowest value in each column.
- Condition - Select to enter a condition. The condition is on the form xstart < x < end and will be evaluated for each cell in the table. Cells who’s value fulfills the condition will be highlighted.
Editing a correlation table
To edit a correlation table either right-click the table in the tables window and select Edit, or double-click the table, or click the  button in the title bar.
The table editor has the following tabs:
- Properties - Allows to change displayed name and other properties.
- Outputs - Select which outputs to include in the table. The outputs should all have the same dimension.
- Indices - Depending on the dimension of the outputs that were selected, you can select which indices to include or to include all indices.
- Time - If the outputs are time dependent, this tab allows you to select which time points to display data for.
- Specific - Select either all time points or specific time points to include
- First - Display the first time point
- Last - Display the last time point
- Max over time - Display the maximum value for each output over time
- Time for max - Display the time point for the maximum value for each output
- Min over time - Display the minimum value for each output over time
- Time for min - Display the time point for the minimum value for each output
- Correlation - This tab allows you to select which coefficients to calculate and how to transform the data.
- Correlation - Select which coefficients to calculate
- Inputs - Select whether to include all selected parameters, or to filter out parameters that cannot influence the selected outputs.
- R squared - Include a Coefficient of determination
