Table of Contents
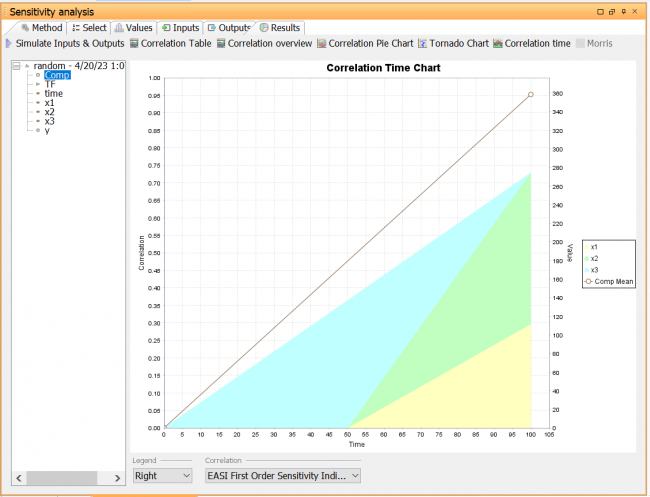
Correlation time chart
The correlation time chart will display how the output correlate with the different inputs over time. It is only available with the sensitivity analysis toolbox.
This chart consists of three superimposed diagrams:
- A stacked line chart showing the time evolution of the correlation coefficients of the inputs to the output.
- A time chart displaying the median value and the 5th and 95th percentile. This plot helps to determine which parameters are of importance when the output is large.
- A line chart showing the coefficient of determination (R2) for the nontransformed variable and the equivalent for the ranked variable (R2’). R2 shows which fraction of the variance of the output that is explained by the regression model. In other words, it is a measure of how well the correlation regression method performs.
Creating a correlation time chart
From the results window (Recommended)
- Click an output that you wish to plot and select Correlation Time Chart from the popup-menu.
From the charts window
- Click the charts window and select Create | Correlation Time Chart from the popup-menu.
Editing a correlation time chart
Some properties can be changed directly by using the controls below the chart. For a correlation time chart there are controls for:
- Legend - Toggle legend on/off
- Correlation - Select ranking method (more information can be found below).
To change other properties either right-click the chart in the charts window and select Edit, or double-click the chart, or click the  button in the title bar.
The chart editor has two tabs:
Properties
This screen let you edit properties such as name, sub-title and position of legend.
Data
- Output - Select the target output.
- Inputs - Select the inputs you are interested in. By default all parameters that are included in the probabilistic/sensitivity analysis are selected.
- Type – Select which correlation ranking method you wish to use.
- EASI First Order Sensitivity Indices
- Spearman’s rank correlation coefficient
- Pearson product-moment correlation coefficient
- Standardized regression coefficient
- Standardized rank regression coefficient
- Partial correlation coefficient
- Partial rank correlation coefficient
- Transformation - Select transformation type (None, rank or natural logarithm)
- Mean - Check if you want to include a plot over the mean value of the output
- Median - Check if you want to include a plot over the median value of the output
- Std. Deviation - Check if you want to include a plot over the Std. deviation value of the output
- Lower percentile - Check this box and enter a value 0>x>100 to include a percentile of the output
- Upper percentile - Check this box and enter a value 0>x>100 to include a percentile of the output
- R2 - Check tif you want to include a plot of coefficient of determination
