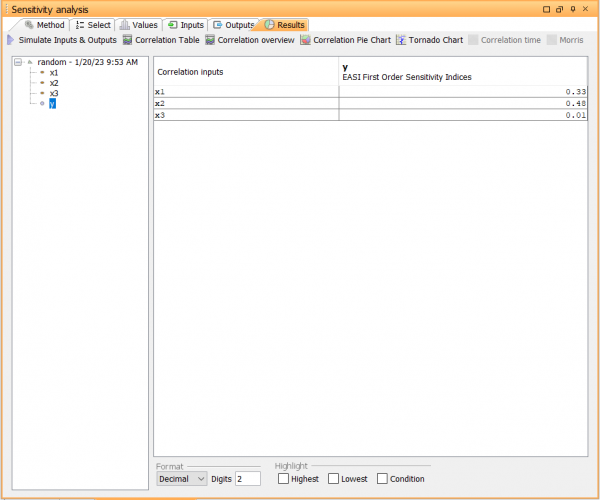
Results view
In the Results tab, in the Sensitivity analysis view, the sensitivity analysis indices from the selected sensitivity analysis method can be inspected.
- Simulate Input & Outputs: Generates input samples for the selected parameters and uses them to simulate the model outputs.
The following charts and tables can be created to inspect the sensitivity analysis indices. To create a chart or table, click an output in the tree and select a chart/table type. Alternatively, select the chart or table in the list.
Tables
- Correlation Table - Displays a sensitivity or correlation measure for all selected outputs
- Correlation Overview Table - Displays all sensitivity or correlation measures for one selected outputs
Charts
- Correlation Pie Chart - Displays the sensitivity or correlation measures in a pie chart
- Correlation Time Chart - Displays the sensitivity or correlation measures in a time chart
- Tornado Chart - Displays the sensitivity or correlation measures in a tornado chart
- Morris Chart - Displays Morris sensitivity measures in a morris chart
